Welcome to the world of Infographic Marketing! In this fast-paced digital era, businesses are leveraging the power of visual storytelling to captivate their audience, and Infographic Marketing has emerged as a game-changer. Curious to know the latest trends and statistics shaping this dynamic landscape in 2023? Look no further! We’ve compiled 30 eye-opening Infographic Statistics that will astound you. Discover the impact of Infographic Marketing, its evolution, and why it’s a must-have tool in every marketer’s arsenal.
The roots of Infographic Marketing can be traced back to ancient civilizations, where pictorial representations conveyed messages effectively. Fast forward to the digital age, the advent of the internet and social media accelerated the popularity of infographics. Over the years, businesses realized the potential of combining data, visuals, and storytelling, leading to the rise of Infographic Marketing as a dominant force in engaging audiences across various platforms.
Ready to dive into the fascinating world of Infographic Marketing? Click here to unravel the full blog and gain valuable insights into the latest Infographic Statistics that will reshape your marketing strategies in 2023. Don’t miss out on this opportunity to stay ahead in the competitive landscape and harness the power of infographics to drive success for your brand. Let’s embark on this visual journey together!
Editor’s Choice Statistics
1. Infographics in High Demand: 65% of Brands Leverage Them
2. Visual Content’s Significance: 69% of Marketers Agree
3. The Power of Visual Information: 90% to the Brain
4. Infographics: A Compelling Read, 30 Times More Likely
5. Web Articles with Images Garner 94% More Views
6. Image-Rich Web Content Leads to 650% More Engagement
7. Infographics Win Over 84% of Users with Their Utility
8. Visuals Dominate Social Media: 74% of Marketers Opt for Images
9. Image-Centric Facebook Posts Garner Double the Engagement
10. Visual Elements Dominate: 74% of Marketing Content in 2019
Top 30 infographic marketing statistics to consider in 2023
1. Visual Content Reigns: 32% of Marketers Prioritize Visuals
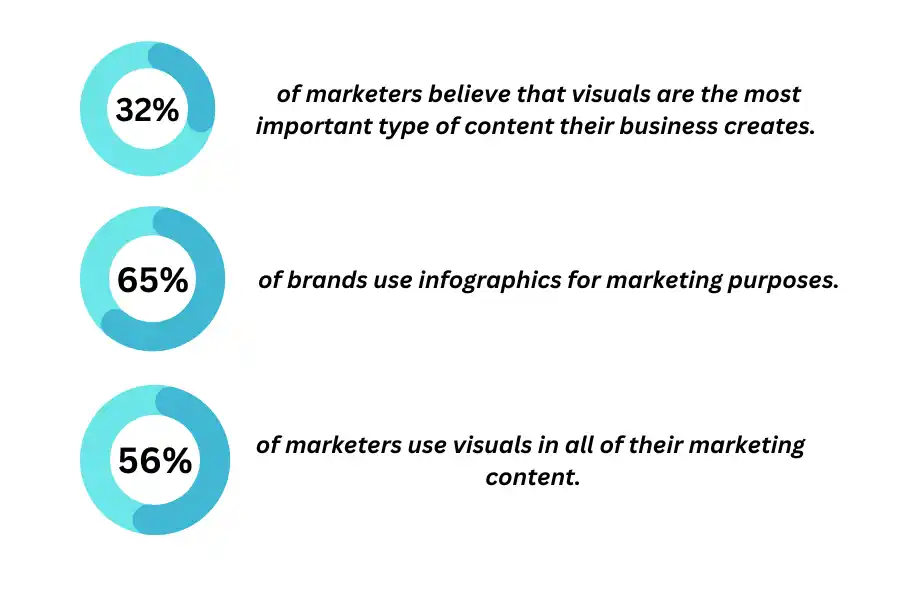
According to a survey, 32% of marketers consider visuals as the most crucial form of content for their businesses. Infographics, images, and videos have proven to be powerful tools for engaging audiences and conveying information effectively. Marketers are increasingly incorporating visual elements to enhance their marketing strategies.
2. Infographics in High Demand: 65% of Brands Leverage Them
A substantial 65% of brands harness the power of infographics for their marketing endeavors. These visually appealing and informative graphics enable brands to communicate complex information in a captivating and easy-to-understand manner. Infographics have become a go-to tool for marketers seeking to engage their audiences effectively.
3. Boost Your Website Traffic: Infographics Drive 12% Increase
Incorporating infographics into your online strategy can have a significant impact on website traffic, increasing it by up to 12%. Infographics are highly shareable and engaging, making them a valuable asset in attracting visitors and driving more organic traffic to your website. Embrace infographics to see a boost in your online presence and reach.
4. Infographics Reign as Fourth Most-Used Content Marketing Type
Infographics hold a prominent position in content marketing, ranking as the fourth most popular type. Their visual appeal and engaging nature make them a valuable tool for marketers seeking to capture their audience’s attention and convey complex information in a compelling way.
5. Visual Content’s Significance: 69% of Marketers Agree
A survey in 2018 revealed that 69% of marketers acknowledged the paramount importance of visual content, categorizing it as either “very important” or “absolutely necessary”. This acknowledgment reflects the growing trend of using visual elements like infographics to enhance marketing strategies
6. Visuals Everywhere: 56% of Marketers Embrace Visual Content
Marketers have recognized the potential of visual content, with 56% incorporating visuals in all their marketing materials. Images, infographics, and videos play a pivotal role in conveying brand messages and evoking emotions. This widespread adoption of visual content showcases its effectiveness in modern marketing strategies.
7. The Power of Visual Information: 90% to The Brain
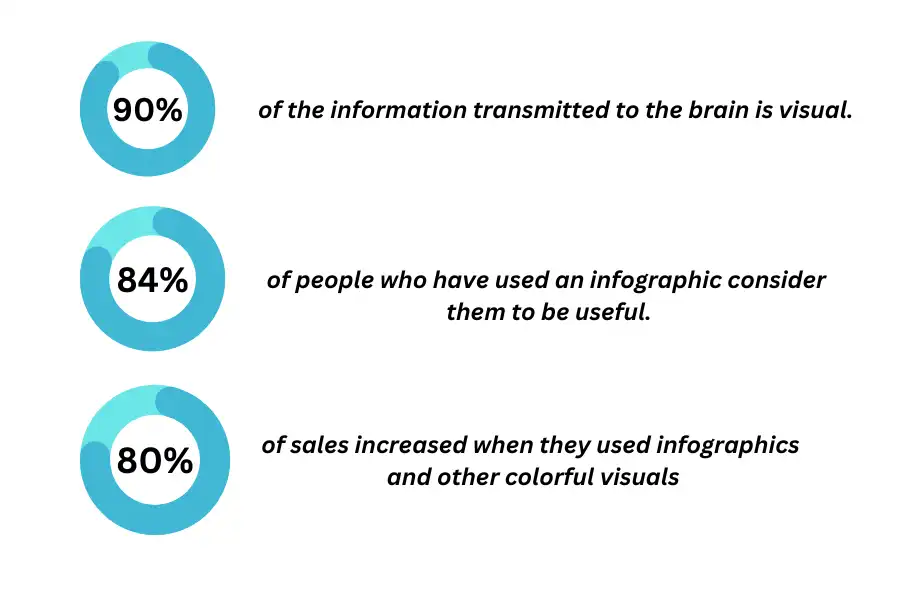
An astounding statistic indicates that a whopping 90% of information transmitted to the brain is visual. This fact underscores the effectiveness of infographics in conveying messages, as they cater to the brain’s preference for absorbing and processing visual data.
8. Visuals vs. Verbal: 65% vs. 10% Memory Retention
Research shows that people retain information differently, with visuals leaving a lasting impact. Individuals remember about 65% of the information presented visually but only about 10% of information they hear out loud. This disparity emphasizes the potency of infographics in delivering memorable messages.
9. Infographics: A Compelling Read, 30 Times More Likely
Infographics have a clear advantage over traditional content formats. According to, they are an impressive 30 times more likely to be read in their entirety compared to blog posts or news articles. This remarkable engagement rate makes them a go-to choice for marketers aiming to captivate their audience.
10. 65% of Buyers Absorb More Information as Visual Learners
Visual content is a powerful tool for engaging buyers, with 65% of them being visual learners. When information is presented in the form of images, graphics, or videos, it resonates better with this audience, leading to increased understanding and retention of key messages.
11. Web Articles with Images Garner 94% More Views
Don’t underestimate the impact of visuals on web content! Articles accompanied by images enjoy a staggering 94% increase in views compared to those without images. Adding relevant visuals not only captures attention but also enhances the overall reading experience.
12. Visual Directions Boost Action Completion by 323%
Clear and concise instructions are essential for guiding readers towards desired actions. By incorporating visuals alongside directions, you can substantially increase the chances of successful action completion by an impressive 323%.
13. Image-Rich Web Content Leads to 650% More Engagement
Want to boost engagement? Embrace visual content! Web content enriched with images sees an astounding 650% surge in engagement compared to text-only content. Visuals capture attention and encourage users to interact and stay on your page longer.
14. Infographics Deemed Highly Useful by 84% of Users
Infographics are a valuable asset in the marketing world. A significant 84% of users find infographics to be highly useful. Their ability to present complex information in a visually appealing and easy-to-digest manner makes them an indispensable tool for communication and engagement.
15. Visual Learners Absorb 65% More Information from Infographics, Images, and Videos
Catering to visual learners is essential in content marketing. Utilizing infographics, images, and videos can significantly enhance information absorption, leading to better engagement and understanding of your message.
16. Boost Article Views by 94% with Eye-Catching Images
Incorporating images into your web articles can be a game-changer for your content’s visibility. Studies reveal that articles enriched with images attract nearly double the views compared to plain text content.
17. 323% Higher Success Rate: Add Visuals to Your Directions
Want your audience to follow instructions more effectively? Pair your textual directions with visual cues. Studies indicate a remarkable 323% increase in successful outcomes when visuals accompany directions.
18. Boost Engagement by 650% with Visual Content
Captivating your audience is easier when you include visuals in your content strategy. The data speaks for itself—content enriched with images experiences a staggering 650% rise in user engagement.
19. Infographics Win Over 84% of Users with Their Utility
Infographics are a powerful tool to convey information effectively. A significant majority, around 84%, of users find infographics highly useful in presenting complex data and ideas concisely.
20. Visual Content Budgets: 42% of Marketers Allocating Less Than 10%
According to a 2018 survey, 42% of marketing teams allocated less than 10% of their budgets to creating visual content. This suggests that a significant portion of marketers may be missing out on the potential benefits of visual content marketing.
21. Infographics Reign on Social Media: Most Liked and Shared Content
Among various content types, infographics stand out as the most liked and shared on social media, as per a study. This indicates that users are highly receptive to visual information presented in an engaging and easy-to-understand format.
22. Image-Centric Facebook Posts Garner Double The Engagement
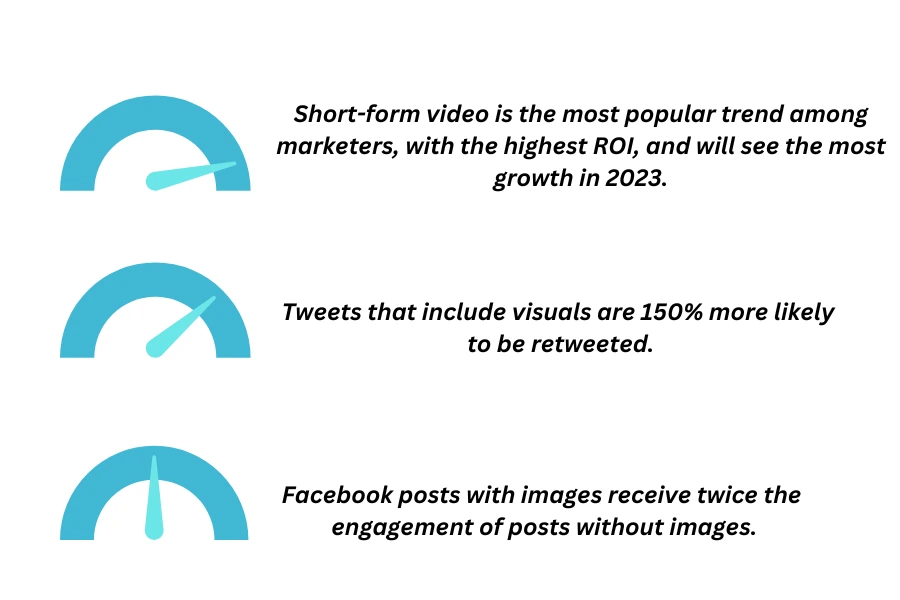
Facebook posts that feature images receive twice as much engagement compared to text-only posts, according to a reliable source. Marketers can leverage this insight to boost their social media reach and interaction with their target audience.
23. Social Media Success: 74% of Marketers Embrace Visuals
A substantial 74% of marketers have integrated visual elements into their social media posts, as stated by a recent report. This underscores the increasing recognition of visuals as a powerful tool to capture attention and communicate messages effectively.
24. Retweet Power: Visual Tweets 150% More Likely to be Shared
Tweets accompanied by visuals have a 150% higher likelihood of being retweeted, as revealed by a reputable study. Twitter users evidently respond favorably to visually compelling content, making it a valuable strategy for increasing tweet engagement.
25. 42% of Marketing Teams Allocate Less Than 10% Budget for Visual Content Creation
A significant 42% of marketing teams allocated less than 10% of their budget in 2018 for creating compelling visual content, despite its proven effectiveness in engaging audiences.
26. Infographics Reign Supreme for Social Media Engagement
Among all types of content shared on social media, infographics emerge as the clear winner, being liked and shared more frequently, fueling higher engagement rates.
27. Harness the Power of Images: Double the Engagement on Facebook
Including images in Facebook posts leads to a remarkable outcome, with twice as much engagement compared to posts without visuals, making it an essential strategy for marketers.
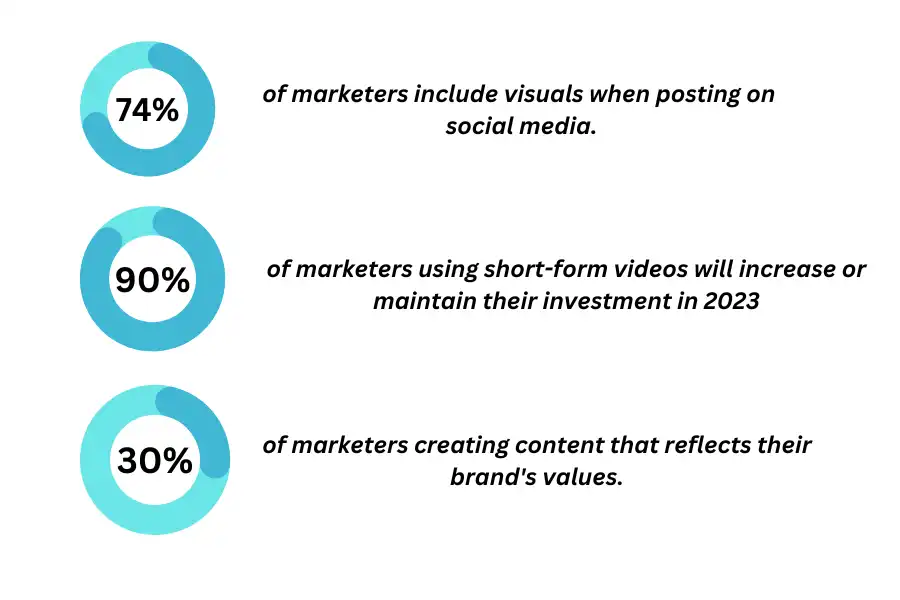
28. Visuals Dominate Social Media: 74% of Marketers Opt for Images
An overwhelming majority of marketers, precisely 74%, capitalize on the power of visuals when posting on social media, recognizing its potential to captivate and resonate with their audience.
29. Boost Your Retweets: Make Visuals a Priority in Tweets
To amplify your Twitter reach, prioritize visuals in your tweets. Statistics reveal that tweets with accompanying visuals are 150% more likely to be retweeted, exponentially increasing their reach.
30. Visual Elements Dominate: 74% of Marketing Content in 2019
In 2019, a significant 74% of marketing content included visual components. This emphasizes the growing importance of visual elements in capturing consumer attention. The prevalence of visuals, such as images, infographics, and videos, demonstrates their effectiveness in conveying messages and enhancing brand com
Conclusion
These Infographic Marketing Statistics for 2023 underscore the undeniable impact of infographics in today’s competitive landscape. By harnessing the power of visual storytelling, businesses can effectively convey their message, boost engagement, and outperform competitors. Infographics have evolved from ancient origins to become a dominant force in modern marketing. Embrace the stats, stay informed, and leverage the potential of infographics—your key to success in the dynamic world of 2023 and beyond. Don’t miss out on the stats infographic revolution shaping the future of marketing!